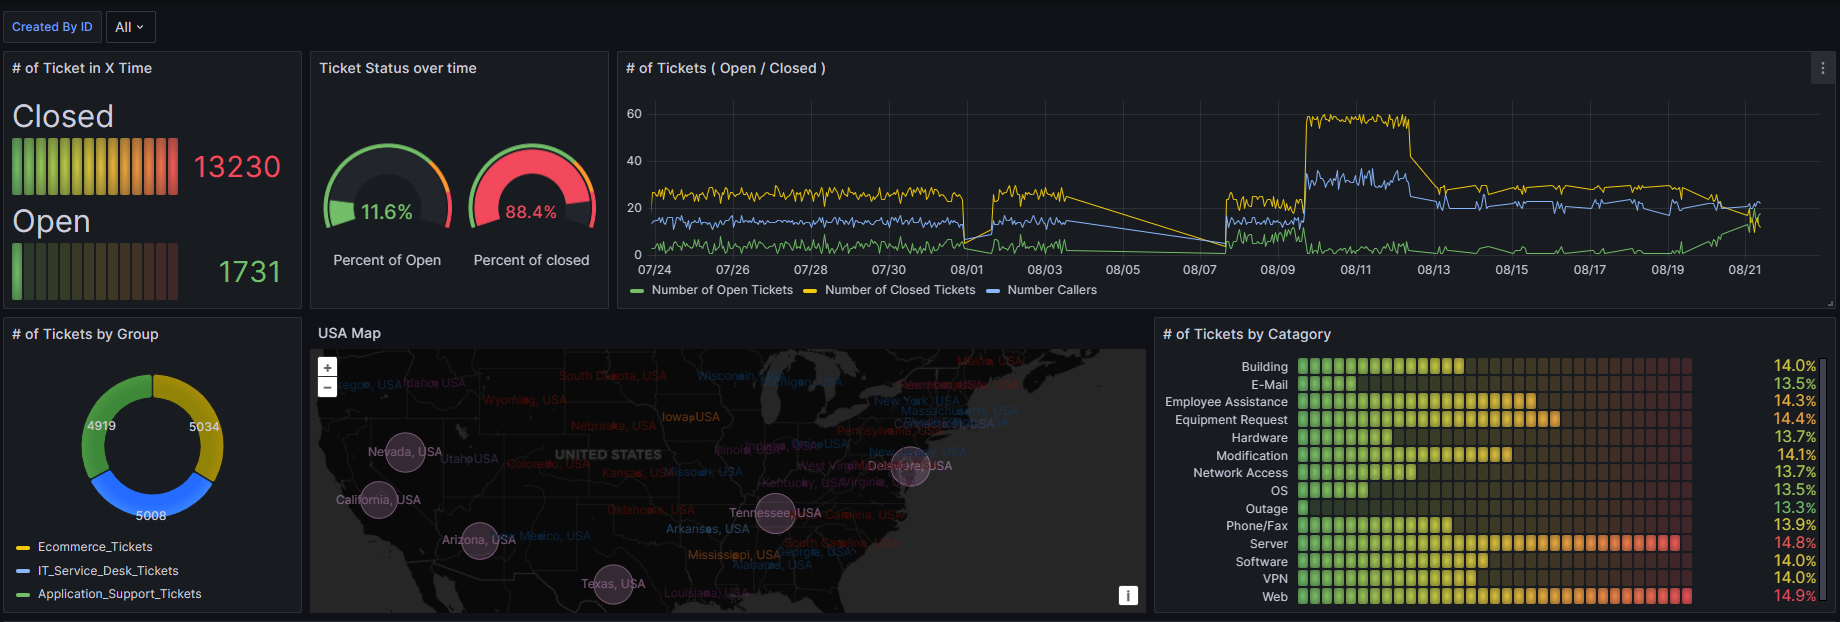
Visualized Data: Make it stand out
As the saying goes, "a picture is worth a thousand words." This holds especially true when it comes to data visualization. In today's data-driven world, the ability to effectively communicate information through visually appealing graphs, charts, and infographics is crucial. However, with the abundance of data available, it's becoming increasingly challenging to make visualized data stand out from the crowd.
